Excel sparklines
Updated: 10/04/2017 by Computer Hope
In Microsoft Excel, Excel sparklines are mini charts within a single cell. There are three types of sparklines that can be created in Excel.
- Column
- Line
- Win/Loss
The Column and Line sparklines are the two most common types used. In the picture below, a Column sparkline (cell H2) and a Line sparkline (H3) are shown.
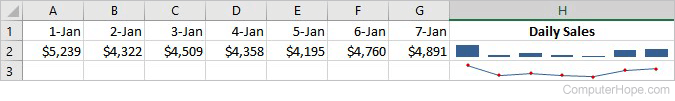
Sparklines are useful for displaying small amounts of data in a graphical format, like daily sales for a week or stock prices by quarter for a year.
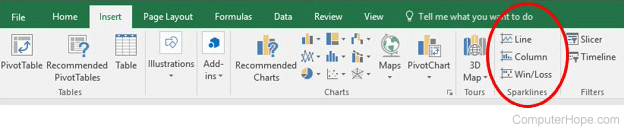
How to create an Excel sparkline
A sparkline can be added to an Excel spreadsheet by following the steps below.
- Click the Insert tab.
- In the Sparklines section, click the type of sparkline you want to add.